Visualization of field outputs is a very common way to qualitative and quantitatively get a measure of the results of our numerical models. In Abaqus, and in most FE software packages, the most popular colormap is the well known “jet” or “rainbow”, which goes from blue to red swinging by green and yellow tones in between. This color palette has become a silent standard, even though is not “visually” fair and tends to distort the visualization of data in most problems. In this post I want to show you how to use your own colormaps in Abaqus and for that we will take advantage of Matplotlib.
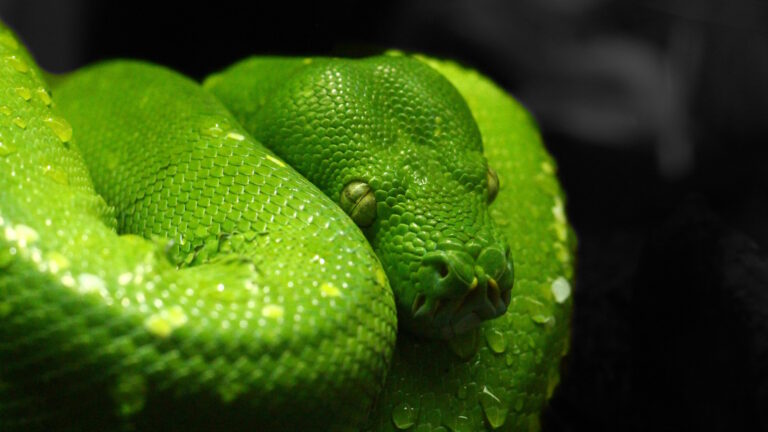
I encourage you to watch this video and this link to find out why the rainbow colormap is visually poor, but as an example, take a look at the image below and judge for yourself. Yes! We can’t barely see any contrast along the upper side of the image using the rainbow colormap (on the right).
Rainbow colormap (right) lacks contrast towards the upper side of the plot compared to the grayscale colormap (left) [from Moreland]
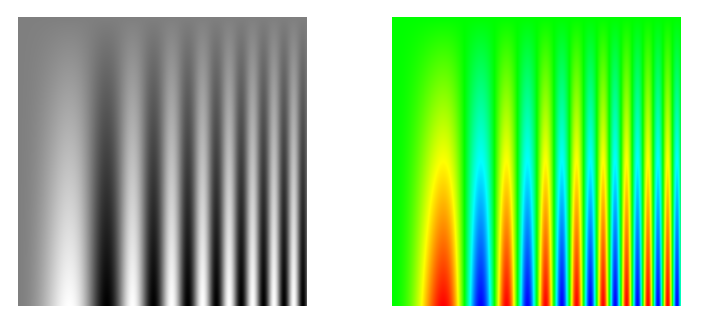
Performance of different colormaps: a) cool-warm, b) rainbow, c) grayscale, d) inferno, e) isoluminant and f) blue-yellow [from Moreland]. Can you guess which are perceptually uniform?
1. Custom colormaps in Abaqus (manually)
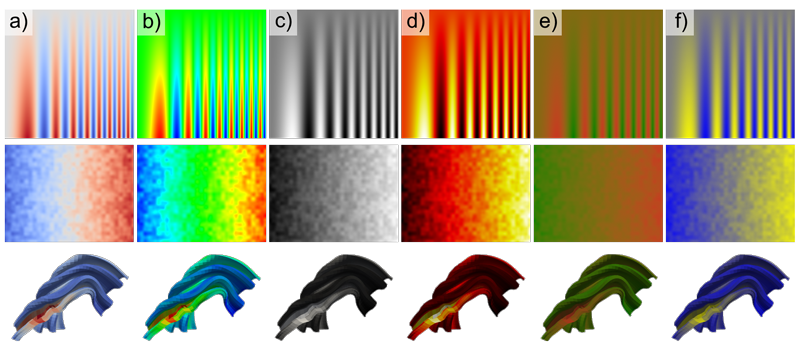
We can set our own colormaps in Abaqus/Viewer manually, by going to:
Contour Plot Options → Color & Style → Spectrum → Create Spectrum
Then we introduce each of the colors to build our desired colormap, hit ok, and finally select it as the current colormap (spectrum).
Steps to create your own colormap (spectrum) in Abaqus/Viewer
In this way we can create our own colormaps in Abaqus and apply them to the visualization of field output variables (displacements, stresses, plastic deformation, damage…).
However, creating colormaps manually is very tedious if we want to use accurate colormaps, for instance those built-in Matplotlib, such as viridis, cividis, inferno or other perceptually uniform sequential colormaps.
2. Custom colormaps in Abaqus (script)
A more practical option to create colormaps in Abaqus is to use a Python script that defines them. Colormaps are created through the following Python function:
session.Spectrum(name, colors)
where name is a string (e.g. “MyCmap”), and colors is a list of strings representing colors in hexadecimal format (e.g. [“#ff0000”, “#00ff00”, “#0000ff”]).
Run the following script to create some stunning colormaps (spectrums) in Abaqus.
- Python
					from abaqusConstants import *

# Perceptually uniform sequential colormaps
colormaps = {'viridis': ['#440154', '#46317e', '#365c8d', '#277f8e', '#1fa287', '#49c26d', '#a0da39', '#fee724'],
             'plasma':  ['#0c0787', '#5301a3', '#8b09a5', '#b93289', '#dc5c68', '#f48849', '#febd2a', '#f0f921'],
             'inferno': ['#000003', '#270b53', '#65156e', '#9f2a63', '#d54841', '#f67d15', '#fbc228', '#fdffa5'],
             'magma':   ['#000003', '#221150', '#5f177f', '#982c80', '#d4436e', '#f9765c', '#ffbb81', '#fcfdbf'],
             'cividis': ['#00224e', '#213b6e', '#4c556c', '#6c6e72', '#8e8978', '#b2a570', '#d9c55c', '#fee837']}

# Colormaps are Spectrum objects in Abaqus/CAE
for name, colors in colormaps.items():

    # Spectrum with the colors in order
    session.Spectrum(name=name, colors=colors)

    # Spectrum with the colors in reversed order
    session.Spectrum(name=name + 'R', colors=colors[::-1])
- Line 1: we need to import abaqusConstants to have access to session.
- Lines 4 to 8: define the colormaps as a dictionary with the name as the key and a list of colors as the value. Colors are defined in hexadecimal format as strings.
- Line 11: iterate through all the colormaps using a for loop.
- Line 14: create the spectrum in Abaqus (colormap).
- Line 17: create the reversed spectrum in Abaqus.
Now, you can use any of these spectrums (viridis, plasma, inferno, magma and cividis) and their reversed versions (viridisR, plasmaR, infernoR, magmaR and cividisR) to visualize data from your odbs!
Quick tip!
You can quickly change the spectrum on display in Abaqus/Viewer from the tree. Go to Spectrums and double-click on the one you wish to apply!
Great! Now you can use these colormaps anytime… However, every time that we open Abaqus/CAE we will need to run this script, so that we can use viridis, inferno… Is there anything we can do to make them available by default?
3. Custom colormaps in Abaqus (environment file)
We can make Abaqus run those Python commands (to create the colormaps) every time Abaqus/CAE opens up, by means of the environment file. The steps to achieve this are the following:
- Find the file custom_v6.env in your Abaqus installation directory. In my case (Abaqus 2020 Student Edition) this is: C:\SIMULIA\CAE\2020SE\win_b64\SMA\site
- This file contains Python commands to customize the behavior and default options in Abaqus/CAE. In older Abaqus versions, the file to edit would be abaqus_v6.env.
- Create a function called ‘onCaeStartUp’ without any arguments and place the lines of the previous inside as shown below (don’t forget to import abaqusConstants before):
- Python
					from abaqusConstants import *

def onCaeStartup():

    # Perceptually uniform sequential colormaps
    colormaps = {'Viridis': ['#440154', '#46317e', '#365c8d', '#277f8e', '#1fa287', '#49c26d', '#a0da39', '#fee724'],
                 'Plasma':  ['#0c0787', '#5301a3', '#8b09a5', '#b93289', '#dc5c68', '#f48849', '#febd2a', '#f0f921'],
                 'Inferno': ['#000003', '#270b53', '#65156e', '#9f2a63', '#d54841', '#f67d15', '#fbc228', '#fdffa5'],
                 'Magma':   ['#000003', '#221150', '#5f177f', '#982c80', '#d4436e', '#f9765c', '#ffbb81', '#fcfdbf'],
                 'Cividis': ['#00224e', '#213b6e', '#4c556c', '#6c6e72', '#8e8978', '#b2a570', '#d9c55c', '#fee837']}

    # Colormaps are Spectrum objects in Abaqus/CAE
    for name, colors in colormaps.items():

        # Spectrum with the colors in order
        session.Spectrum(name=name, colors=colors)

        # Spectrum with the colors in reversed order
        session.Spectrum(name=name + 'R', colors=colors[::-1])
- Line 3: definition of the function onCaeStartup.
- Lines 6 to 19: all the commands from the previous script are put into this function.
Like this, whenever we start Abaqus/CAE, these colormaps will be created and they will be available anytime!
Or not? Are you wondering how did I get the lists of colors yet?
Would you like to add different colormaps?
4. Go further with Matplotlib!
In the script above, the lists of colors were hard-coded, nevertheless we can create those color lists on runtime by accessing the Matplotlib colormaps.
In this way, we can include additional colormaps very easily, just by adding their names to the list of names (e.g. spring, cool, Wistia…). See the full list of colormap names in Matplotlib here.
- Python
					# Import matplotlib (available from Abaqus 2020)
import matplotlib.pyplot as plt
import matplotlib
import numpy as np

# List of colormaps
names = ('viridis', 'plasma', 'inferno', 'magma', 'cividis',  # perceptually uniform
         'summer', 'autumn', 'spring', 'cool', 'hot', 'Wistia')  # other colormaps

for name in names:

    if name not in plt.colormaps():  # Skip colormap if not found
        print('Colormap not found: ' + name)
        continue

    # Get Matplotlib colormap by name
    cmap = plt.get_cmap(name)

    # Take 10 evenly spaced colors from the colormap
    # A colormap takes values from 0 to 1 an returns a color: (R, G, B, A)
    colors_rgba = map(cmap, np.linspace(0., 1., 10))

    # Convert RGBA colors into hexadecimal format: #rrggbb
    colors_u = map(matplotlib.colors.to_hex, colors_rgba)

    # Convert unicode strings to regular strings
    colors = list(map(str, colors_u))

    # Colormaps are Spectrum objects in Abaqus/CAE
    session.Spectrum(name=name, colors=colors)  # Colormap
    session.Spectrum(name=name + 'R', colors=colors[::-1])  # Reversed colormap
- Lines 2 & 3: we need to import matplotlib library (and pyplot).
- Lines 7 & 8: define a list with the names of the colormaps that will be read from Matplotlib.
- Lines 12 to 14: skip the current colormap if it is not found among the colormaps available in Matplotlib (plt.colormaps()).
- Line 17: get the colormap from its name (plt.get_cmap(name)).
- Line 21: generate 10 evenly spaced colors of the current colormap (colors_rgba). These colors are tuples with Red-Green-Blue-Alpha values (R, G, B, A).
- Line 24: convert the colors in RGBA format to hexadecimal format strings.
- Line 27: the strings from line 23 are unicode, so we have to translate them into a list of regular strings.
5. Summary
In this post we have covered how to create our own colormaps in Abaqus and use them for the visualization of field outputs. We can do it manually in Abaqus/CAE or take advantage of Python scripts to speed up this process.
We have also taken the opportunity to have a quick glimpse at the possibilities of using Abaqus environment files. In this particular case, to customize the Abaqus interface by creating custom colormaps based on the Matplotlib library.
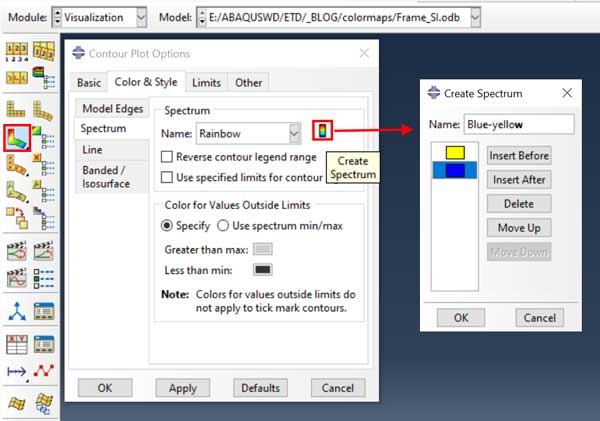
To conclude, below these lines you can take a look at the same simulation using 3 different colormaps. Which one do you like the most? Which one would you use to impress your customer / supervisor / colleagues?
Comparison of three different colormaps (rainbow, cividis and inferno) in the simulation of a cutting process of a thick sheet of aluminum. Variable shown is equivalent plastic strain (PEEQ)
And if you want to get started in Abaqus Scripting with Python, check out this post to learn how to create your own scripts.
I hope that you find these tips useful!